
Home Blog

CRE CLO Distress Accelerates in August

0

The CMBS Market Remains Weighed Down by CRE CLO and SASB Loans Issued in 2021 and 2022

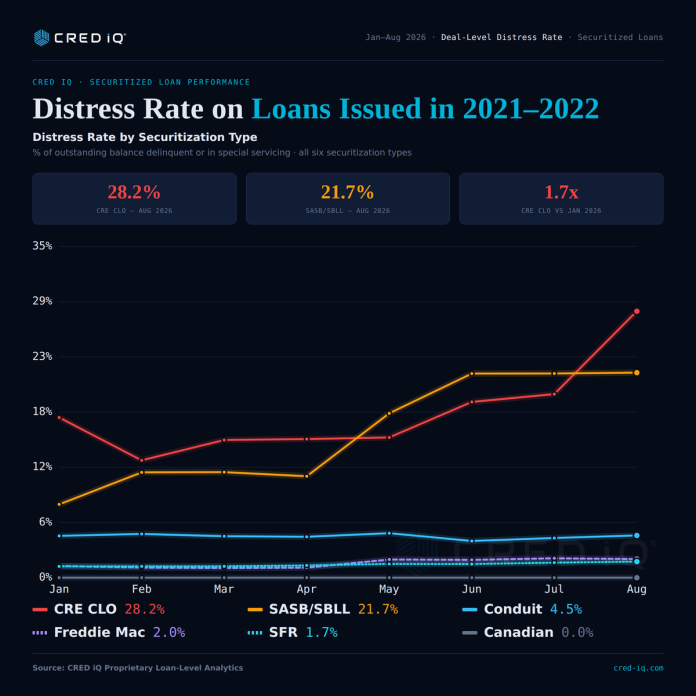
CRE CLO’s distress rate jumped from 19 percent in July to 28 percent in August, the sharpest one-month move of any deal type this year. SASB has held near 22 percent since June. Both trace to the same two origination years: 2021 and 2022 vintage loans now carry $3 billion of CRE CLO’s special-servicing balance and $1.7 billion of SASB’s, against $27 billion and $17 billion outstanding. In both cases the distress sits in a handful of large, identifiable deals rather than spread across the market.

The chart below puts these two deal types in context against the rest of the securitized universe. Conduit, Freddie Mac, and SFR have barely moved in eight months, each still under five percent. CRE CLO and SASB are the only categories that have crossed into double digits — a divergence specific to 2021-and-2022 vintage collateral, not the broader lending market.
Distress rate by securitization type, loans issued 2021–2022
Distress rate by securitization type, loans issued 2021–2022. Source: CRED iQ proprietary loan-level analytics.

CRE CLO: A Single Portfolio Is Doing Most of the Damage

FSRIA 2021-FL3 is the largest contributor, with $353 million of multifamily collateral now in special servicing across seven loans. It has added a new default roughly every eight weeks throughout 2026, and August brought two more: River Crossing at Roswell ($49 million) and Grace Abernathy Apartments in Sandy Springs, Georgia ($42 million), both tied to 2026 balloon maturities. Add the July transfer of 415 Premier Apartments in Evanston, Illinois ($40 million), and this one deal has moved $131 million into distress since spring.

ARCLO 2022-FL1, a similar Sunbelt bridge-loan CLO, added The Residences at Medical in San Antonio ($27 million) and Pebblebrook Apartments in Redlands, California ($12 million) this cycle for $210 million of newly distressed collateral in August alone. Five deals now account for 38 percent of all CRE CLO special-servicing balance, and the ten largest deals hold 58 percent. Texas, Florida, and Georgia alone carry 44 percent of the distressed balance — bridge loans underwritten on rent growth that never showed up before their floating-rate plans ran out of runway.

SASB: Four Office and Lab Portfolios Carry Two-Thirds of the Category

SASB’s distress is concentrated instead in four single-borrower office and lab deals worth 64 percent of the category’s $1.7 billion balance. BXHPP 2021-FILM, a $525 million loan against seven Hollywood studio and office properties, transferred in July. ALEN 2021-ACEN ($203 million, Three Allen Center, Houston) and LIFE 2021-BMR ($190 million, life-science space across Cambridge, San Diego, and the Bay Area) both transferred earlier this year.

The newest addition, BSREP 2021-DC, transferred August 10: a $162 million loan against eight Washington, D.C.-area office buildings. Its size has roughly offset whatever balance SASB resolved elsewhere this summer, which is why the rate hasn’t moved. California, New York, and D.C. now hold two-thirds of SASB’s distressed balance.

What It Means Going Forward

Office and mixed-use loans maturing over the next nine months are pricing 170 to 180 basis points above their in-place notes, the widest refinancing gap of any property type — the market BSREP and LIFE will resolve into. CRE CLO’s Sunbelt loans face the same wall from a different angle: floating-rate plans built on 2021 and 2022 rent growth that never materialized.

Source: CRED iQ proprietary loan-level analytics. CRE CLO and SASB loans originated 2021–2022, deduplicated to unique loans from property-level records and cross-referenced against CRED iQ’s August 2026 distressed-loan alert log. Distress = special servicing or non-performing/delinquent status, as reported through the September 3, 2026 data pull.
Property Types Feeling the August Heat

0

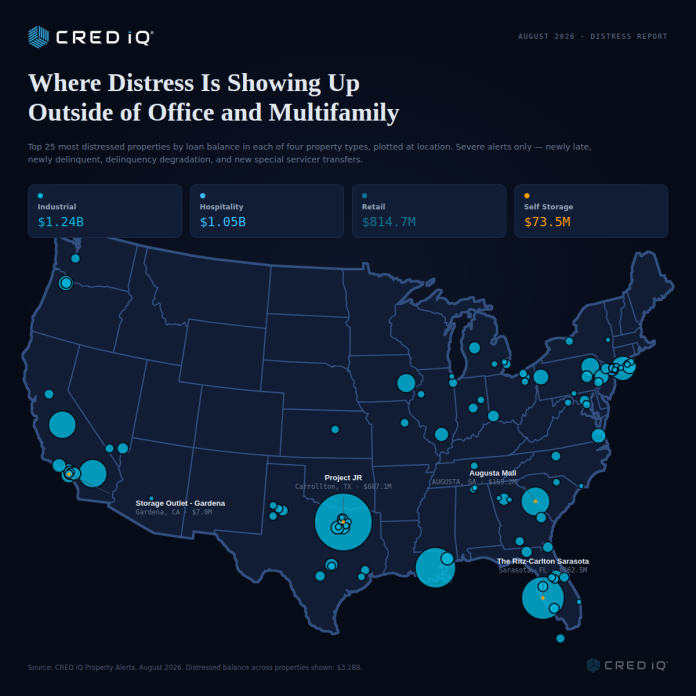
Industrial, hospitality, retail, and self storage post $4.6 billion in new distress

The CRED iQ distress rate bottomed at 10.11% in April and rose for three consecutive months, reaching 10.78% in July. The special servicing rate followed the same pattern, climbing from 9.73% to 10.02% over that stretch, and the delinquency rate moved from 8.08% to 8.67%. Early August figures point to a fourth straight increase across all three measures, though the month is still being finalized.

Property Type Analysis

Industrial produced the single largest distressed loan in the entire report. Project JR, a warehouse and logistics property which has been converted to a data center in Carrollton, Texas, was originally structured with extension options and the borrower exercised the first of three options in June to push out its maturity. Midland, the servicer, nonetheless initially reported the loan as Performing Matured in early August; that status was later revised to Current. Across six pari passu notes (CONE 2024-DFW1), the loan totals $687.1 million. Industrial distress overall reached $1.41 billion across 101 severe alerts this month.

Hospitality distress centered on two large, name-brand assets. The Hyatt Regency New Orleans, a $325 million loan (NOHT 2019-HNLA), transferred to special servicing on a payment default — the largest new special servicer transfer of the month across any property type. The Ritz-Carlton Sarasota, a $362.5 million loan across four notes (BAMLL 2024-BHP), is now Newly Delinquent (Performing Matured) after missing its September maturity while continuing to pay. Hospitality distress overall reached $1.17 billion across 88 severe alerts this month.

Retail distress this month clustered in regional and outlet malls, coast to coast. Augusta Mall in Georgia, a combined $155.2 million across two notes, moved to Non-Performing Matured status on a balloon payment default. Fresno Fashion Fair Mall, $140 million combined across two notes, and Harlem USA in Manhattan, $108 million combined, both transferred to special servicing on imminent maturity default. Coral Ridge Mall in Iowa ($61.7 million) and The Shoppes at South Bay in Torrance, California ($37 million) both went newly late. Grove City Premium Outlets in Pennsylvania and Gulfport Outlet Mall in Mississippi, tied to the same MSC 2015-UBS8 deal, added $64 million combined. Retail distress overall reached $951.4 million across 89 severe alerts this month.

Self storage distress traced almost entirely to two national portfolio operators. A Prime Storage portfolio securitized in BMARK 2023-V4, $57.9 million across 91 properties spanning New York, Florida, Georgia, North Carolina, Connecticut, Arizona, Rhode Island, and Virginia, registered as newly late in the same cycle. A separate U-Haul portfolio in CD 2017-CD6, $23.6 million across 39 properties in more than a dozen states, did the same. Together the two portfolios account for the bulk of self storage’s $124 million in distressed balance this month, in a property type generally treated as close to recession-resistant.

Market Context

A limited refinancing environment combined with elevated interest rates continues to push loans past maturity across property types, not only the office and multifamily loans that typically dominate distress coverage.

Source: CRED iQ Property Alerts, August 2026. “Distress” includes Newly Late, Newly Delinquent (all maturity statuses), Delinquency Degradation (all stages), and New Special Servicer Transfer alert categories; excludes New Watchlist Loan additions.

The Maturity Wall Is Getting Taller

0

Refinancing costs are rising sharply on the $100 billion in loans coming due over the next nine months

More than 2,600 conduit and SBLL CMBS loans, carrying a combined outstanding balance over $100 billion, mature over the next nine months. The balance-weighted distress rate across that pool is 5.55 percent — a manageable-looking average that hides which property type is really under stress, how concentrated the balance is geographically, and which loans that look fine today are headed for a far harder refinancing.

Multifamily Is Under Stress and Relief Isn’t Coming

Office carries the highest distress rate of any major property type in this maturing pool, at 9.4 percent on $23.86 billion — unsurprising. More telling: multifamily, at $5.01 billion, shows a 7.5 percent distress rate — higher than retail’s 3.5 percent and higher than hotel’s 4.4 percent. Multifamily is conventionally treated as the safer bet, especially set against retail’s long-running “death of the mall” narrative. In this pool, it’s the other way around.

Refinancing Costs Are Landing Far Harder on Some Property Types Than Others

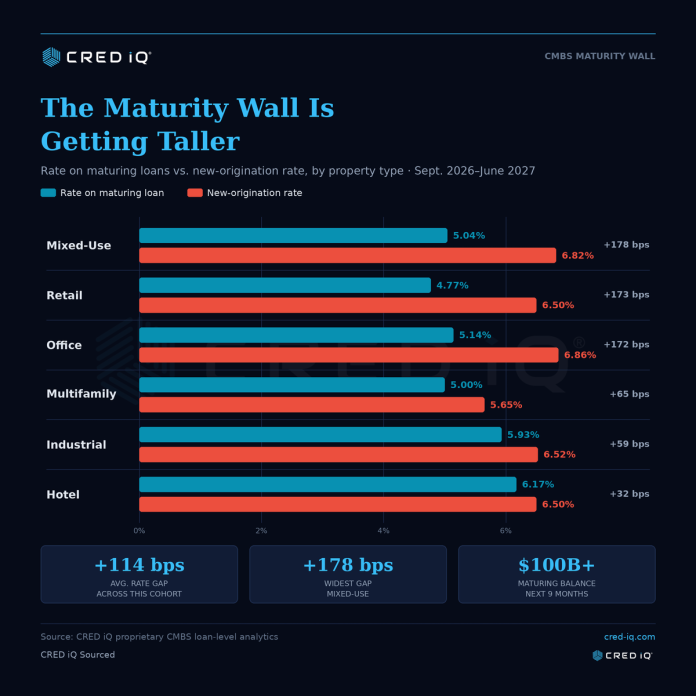
Distress rates capture what’s already gone wrong. They don’t capture what’s coming. Across office, hotel, industrial, retail, mixed-use and multifamily debt maturing in this window, the average note rate on those loans today is 5.44 percent. Loans actually originated between May and August of this year — the real cost of replacing that debt — are pricing at a loan-weighted 6.58 percent, a gap of about 114 basis points that applies whether or not a loan is currently flagged as distressed.

Property Type Rate on Maturing Loan New-Origination Rate Gap
Mixed-Use 5.04% 6.82% +178 bps
Retail 4.77% 6.50% +173 bps
Office 5.14% 6.86% +172 bps
Multifamily 5.00% 5.65% +65 bps
Industrial 5.93% 6.52% +59 bps
Hotel 6.17% 6.50% +32 bps

That gap isn’t uniform, and it doesn’t track with where distress is showing up today. Mixed-use and retail — two of the cleanest performers on trailing distress — face the widest resets, at +178 and +173 basis points; office is close behind at +172. Hotel, despite carrying the highest current rate of any major property type, faces the smallest gap, just +32 bps, because those loans were already priced closer to today’s market. A loan with no problems today can still walk into a materially higher payment the moment it refinances. Call it shadow distress: a risk hiding inside this wall’s currently “clean” loans that today’s distress numbers alone will never show.

A Fifth of the Entire Maturity Wall Sits in One Metro

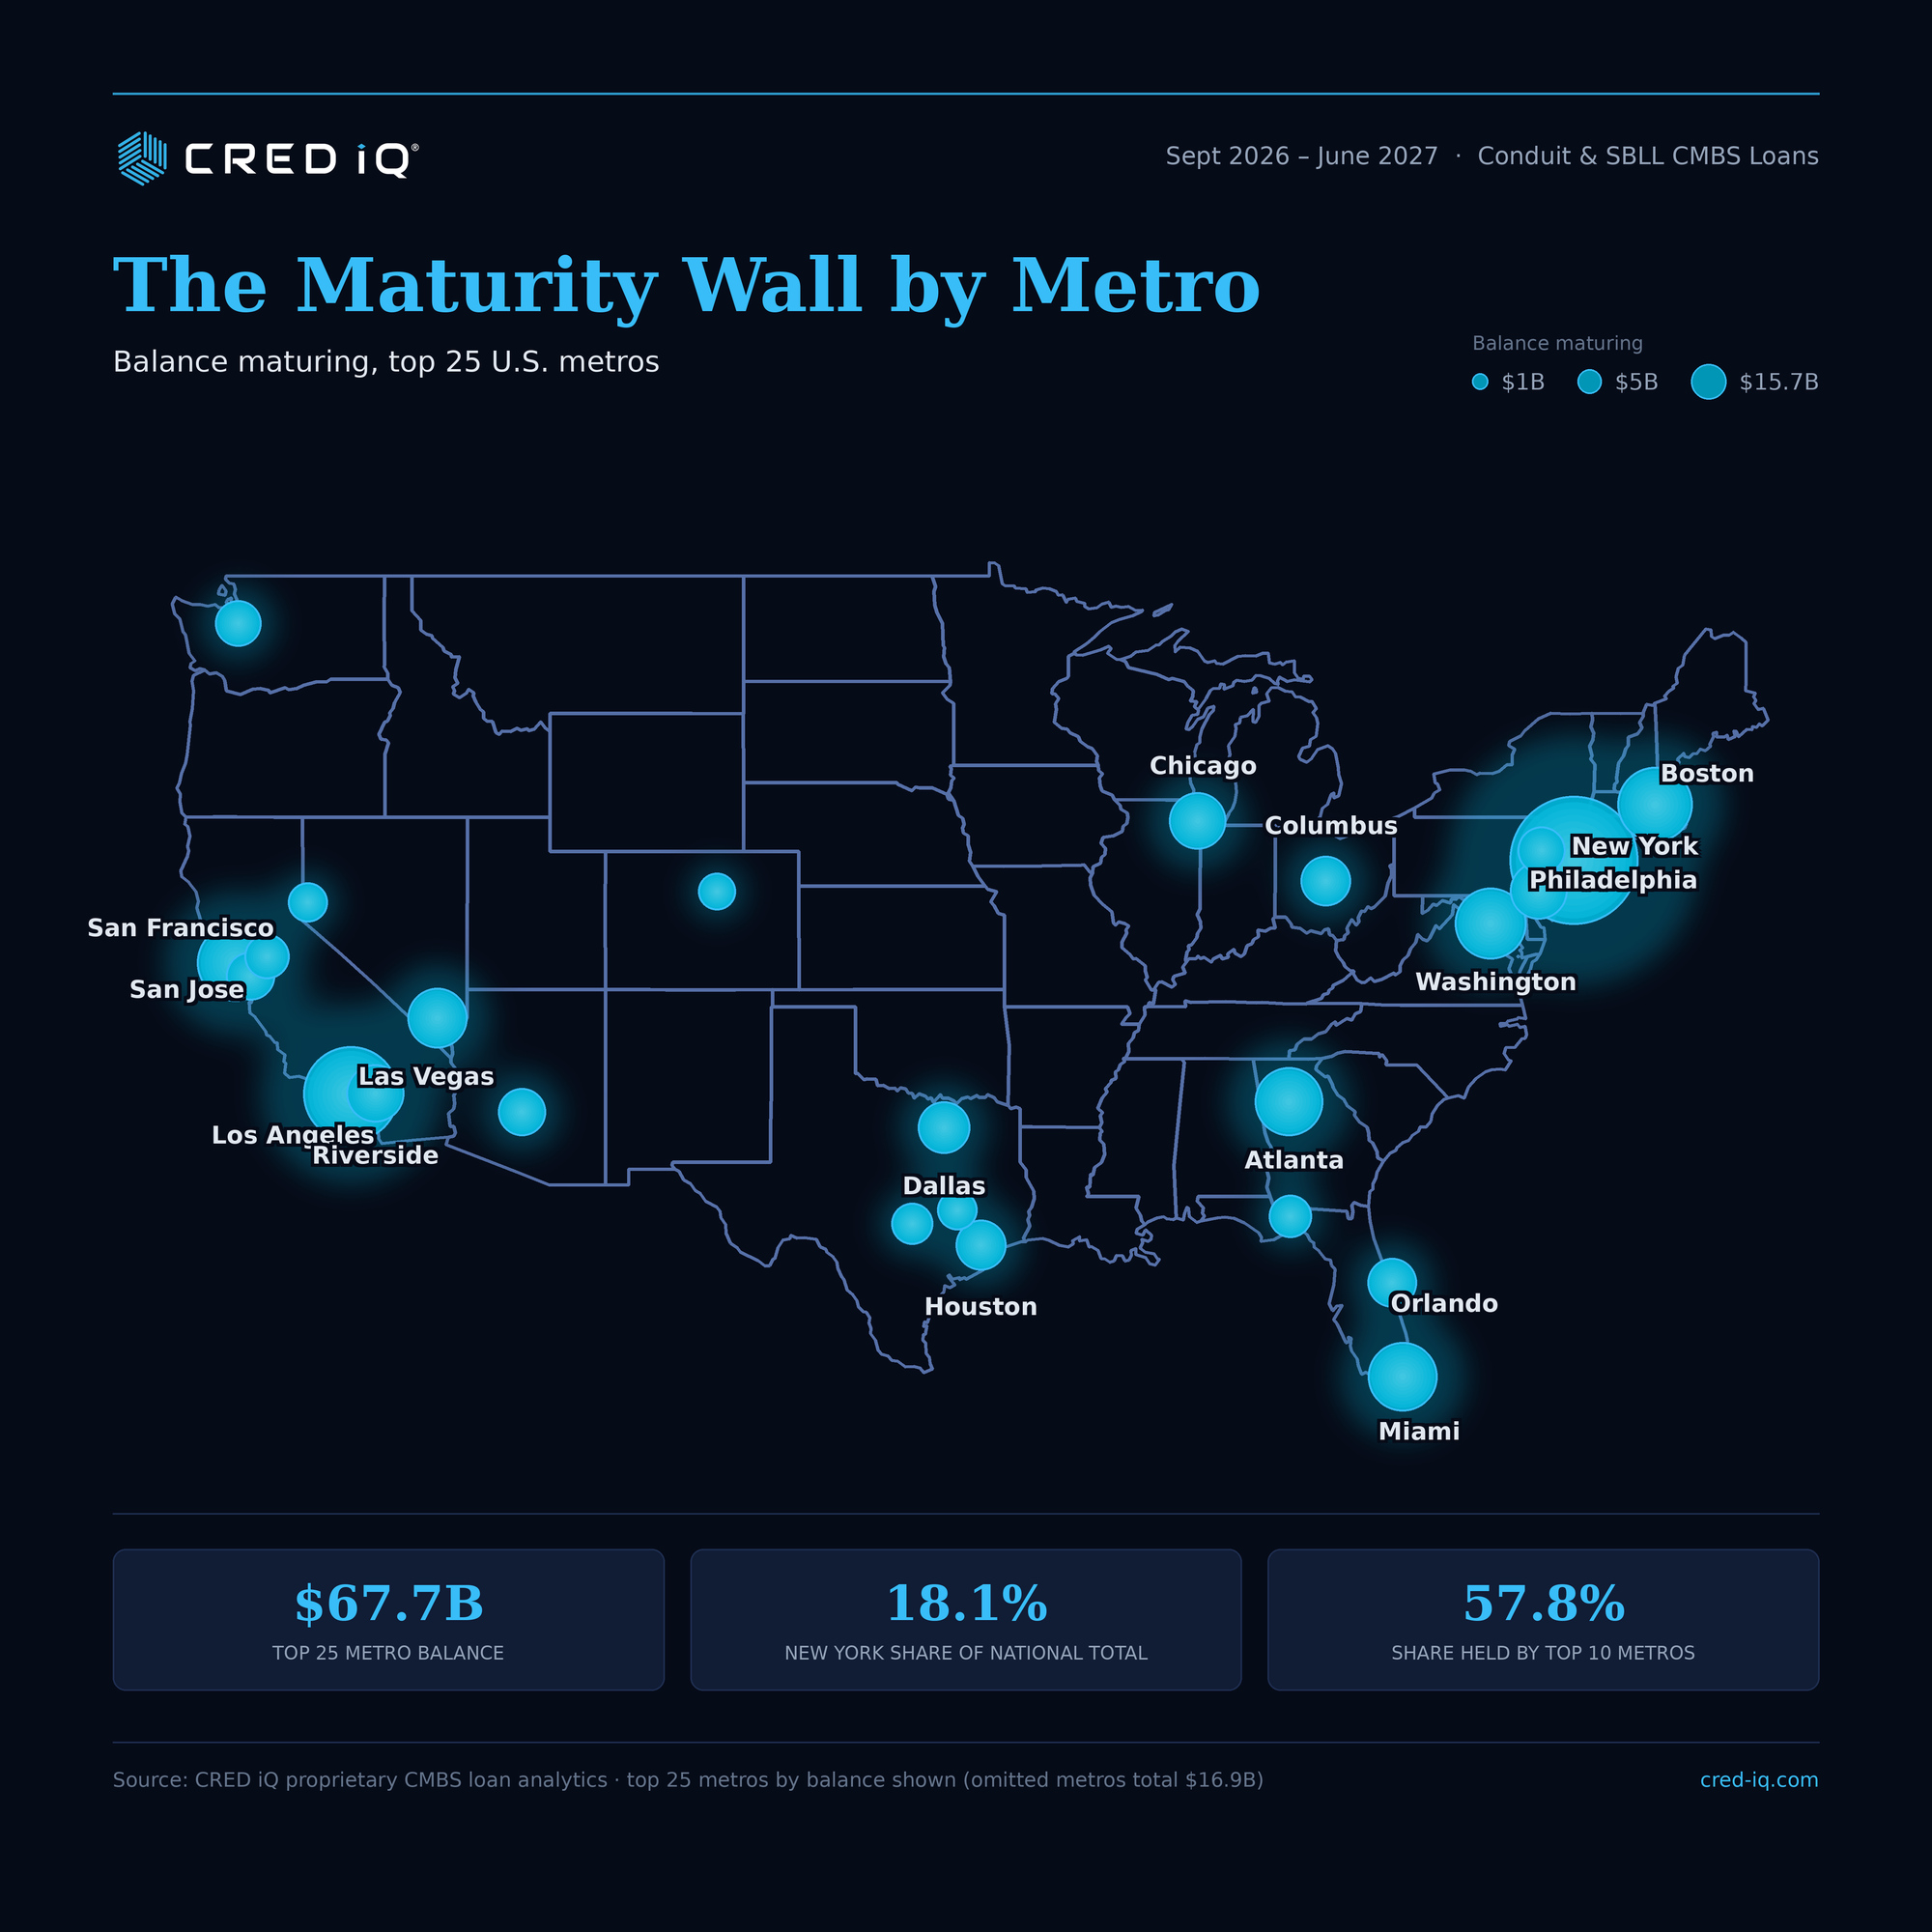
Just 10 of the 371 metro areas in this data account for 57.8 percent of the full $87.8 billion balance. New York-Newark-Jersey City alone is $15.87 billion — 18.1 percent of the national total. Los Angeles ($7.81B) and San Francisco ($4.70B) round out the top three. The map below shows the concentration: a wall sitting hard in a handful of gateway markets, not spread evenly across the country.

CMBS Maturity Wall — balance maturing by metro

CMBS Maturity Wall — balance maturing by metro

The Maturity Wall Has Many Large Bricks

A single retail property in Honolulu carries a $1.73 billion loan maturing in June 2027 — larger than the combined balance maturing in most other metros in this data. It’s almost certainly Ala Moana Center, given its scale and financing history. That’s the largest single loan in the entire maturity wall, but it isn’t the only brick this size.

A $1.69 billion office loan on Binney Street in Cambridge, Massachusetts — in the heart of the Kendall Square life-science and lab-office corridor — matures in May 2027. A $1.52 billion retail loan on Fallbrook Avenue in Los Angeles matures in March 2027. In New York, three trophy office towers on Sixth Avenue and Park Avenue alone account for well over $1.4 billion in maturing balance across three different months: 1290 Avenue of the Americas ($673 million, November 2026), 1095 Avenue of the Americas ($544 million, February 2027), and 280 Park Avenue ($430 million, September 2026).

These loans aren’t uniformly healthy, either. 280 Park Avenue is already showing real strain, while its Sixth Avenue counterparts and Ala Moana Center are considered comfortable performers today — though comfortable now is exactly the kind of loan the shadow distress problem above is about. Whatever shape each loan is in today, its outcome — refinanced smoothly, extended, or handed back — is large enough to move the numbers for its entire metro and, in some cases, for the property type nationally. A reminder that a handful of single-asset loans can swing those numbers on their own, and that the loan-level detail is where the real risk in this maturity wall actually lives.

What’s Actually Driving the Worst Pockets of Distress

January 2027’s distressed balance is spread across four office loans in four separate gateway metros — New York, Washington, Seattle, and San Francisco — all stressed in the same 30-day window. That’s not one bad loan; it’s an office-specific pattern hitting four of the country’s largest office markets at once. September 2026 tells a different story: a lodging portfolio and a Chicago office loan are fully distressed, but a $699.7 million New York office loan, only 10.4 percent distressed, still contributes more dollars just by being large — size and distress rate both doing real work.

The Takeaway

The 5.55 percent headline distress rate is a reasonable-looking average built from pieces that disagree: a national number that’s really a New York number in disguise, a property type reputation that doesn’t hold up in this cohort, and a refinancing reset hitting some property types far harder than others — one that will eventually catch today’s clean, performing loans too.


Source: CRED iQ proprietary CMBS loan-level analytics. Conduit and SBLL deal types only. Loans maturing September 1, 2026 through June 30, 2027.

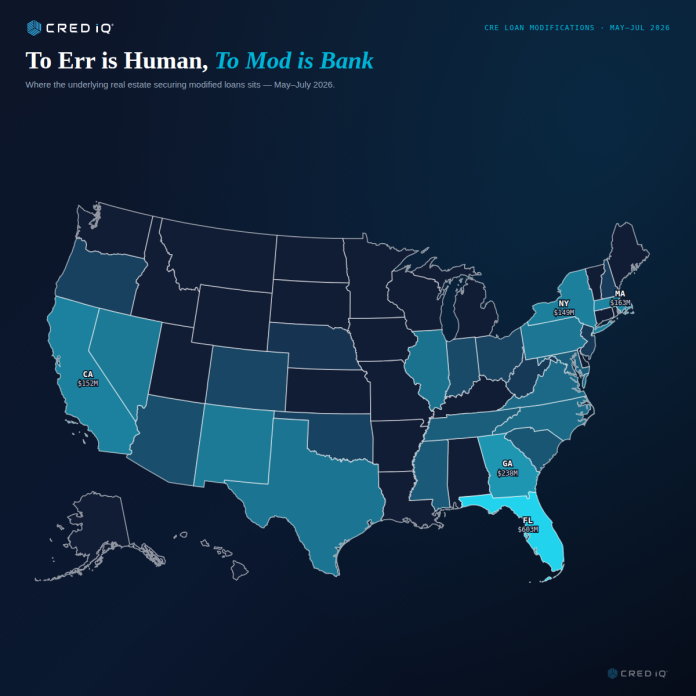
To Err is Human, To Mod is Bank

0
Modified loan balance by state, based on property-level allocated balance (May–July 2026).

CRE Loan Modifications: May–July 2026 Report

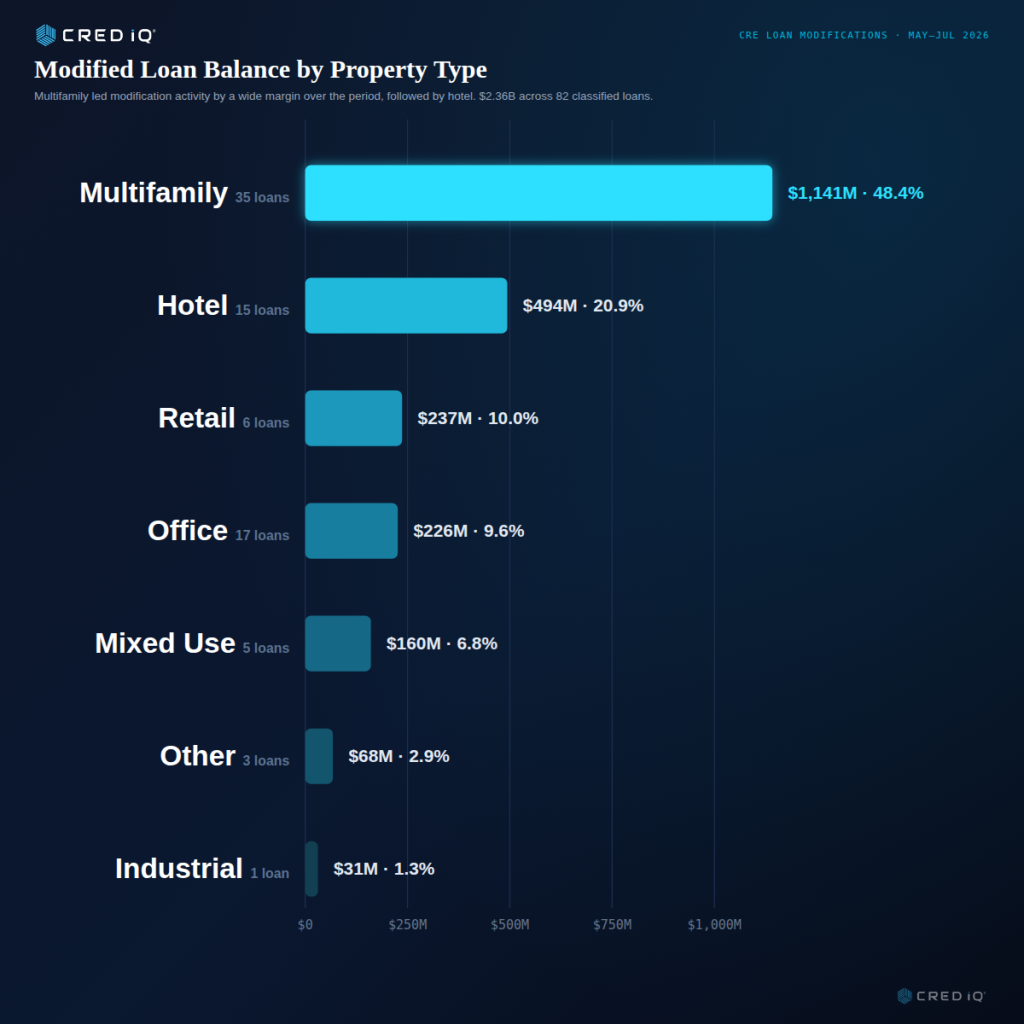
Summary. CRED iQ tracked 82 modified CMBS and CRE CLO loans with a combined $2.36 billion in outstanding balance from May through July 2026. The mix looks different than it did a few quarters ago: extend-and-pretend hasn’t disappeared, but it’s no longer the whole story. Forbearances and combination modifications are now carrying meaningful weight alongside straight maturity extensions, and the balance is concentrated in mid-size loans rather than mega-loans. The property type with the most modifying isn’t hotels or office anymore — it’s multifamily.

Overview of Recent Modification Activity

Of the $2.36 billion modified during the period, maturity date extensions remained the single largest category: 21 loans totaling $802.5 million, or 34.0% of modified balance (25.6% of the loan count). Forbearances followed at 15 loans and $514.0 million (21.8% of balance), while combination modifications — deals pairing an extension with other relief, such as a paydown, rate adjustment, or reserve requirement — accounted for 10 loans and $345.6 million (14.7% of balance). The remaining 36 loans, $695.4 million (29.5% of balance), fell into other or miscellaneous modification categories.

Taken together, extensions, forbearances, and combination mods — the categories most closely associated with lenders buying time on distressed collateral — made up 70.5% of modified balance this period, down from the near-universal “extend and pretend” theme of recent reports. Lenders appear to be reaching for a broader toolkit than a simple maturity push.

Modifications by Property Type

Multifamily loans led modification activity by a wide margin, a shift from the hotel- and office-driven distress of previous quarters:

  • Multifamily: 35 loans totaling $1.14 billion (48.4% of modified balance)
  • Hotel: 15 loans totaling $493.8 million (20.9%)
  • Retail: 6 loans totaling $236.7 million (10.0%)
  • Office: 17 loans totaling $226.2 million (9.6%)
  • Mixed Use: 5 loans totaling $160.5 million (6.8%)
  • Other: 3 loans totaling $67.6 million (2.9%)
  • Industrial: 1 loan totaling $31.2 million (1.3%)

Multifamily’s rise to the top of the modification table is notable given the sector’s reputation for relative stability earlier in the cycle. Rate resets on floating-rate loans and slower rent growth in oversupplied metros appear to be catching up with borrowers who underwrote to more favorable financing conditions. Hotel remains a source of distress, at roughly a fifth of modified balance. Office, long the poster child for CRE distress, accounted for under 10% of modified balance this period — a smaller share than either multifamily or hotel.

Modifications by Loan Size

Unlike the prior report, where loans of $100 million or more drove the bulk of modified balance, mid-size loans dominate this period:

  • $20M–$50M: 38 loans totaling $1.22 billion (51.7% of modified balance)
  • $50M–$100M: 8 loans totaling $554.3 million (23.5%)
  • $100M+: 2 loans totaling $280.0 million (11.9%)
  • $10M–$20M: 18 loans totaling $275.1 million (11.7%)
  • Under $10M: 16 loans totaling $28.8 million (1.2%)

Loans of $50 million and above make up 35.4% of modified balance, but the majority of activity — both by count and by dollars — now sits in the $20M–$50M range. The average modified loan balance was $28.7 million; the median was $23.1 million, reinforcing that this period’s distress is showing up in the broad middle of the market rather than in a handful of trophy-asset workouts.

Key Findings

The May–July 2026 data points to a modification landscape that’s broadening rather than concentrating. Multifamily has overtaken hotel and office as the property type generating the most modification activity, a reminder that distress rotates across sectors as financing conditions and local fundamentals shift. The loan-size distribution has also flattened: rather than a small number of massive loans accounting for most of the dollar volume, mid-size loans in the $20M–$50M band now carry the largest share of modified balance. And the modification toolkit itself looks more varied, with forbearances and combination structures closing the gap on the maturity extensions that once defined “extend and pretend.”

None of this means distress has eased — $2.36 billion in loans needed some form of relief over three months, and more than 70% of that balance came in the form of extensions, forbearances, or combination modifications built to buy borrowers’ time. But the shape of that distress has changed, and lenders and borrowers alike appear to be working from a wider set of options than a maturity date extension alone.

About CRED iQ. CRED iQ manages access to over $2.3 trillion of CRE loans and provides data analytics serving investors, lenders, and brokers in the commercial real estate sector.

Methodology note: Loan-level modification activity was aggregated from property-level servicer data by deal and loan ID. Where a single loan spans multiple properties, the loan was assigned to the property type representing the largest share of allocated balance. Loans with no usable property-level detail in the underlying data (14 loans, $582.4 million) were excluded from this report. The state map reflects property-level allocated balance rather than loan-level totals, since a single loan can span multiple states.

CRE & CMBS Distress Report: Top 50 U.S. Metro Rankings and What’s Driving Them

0
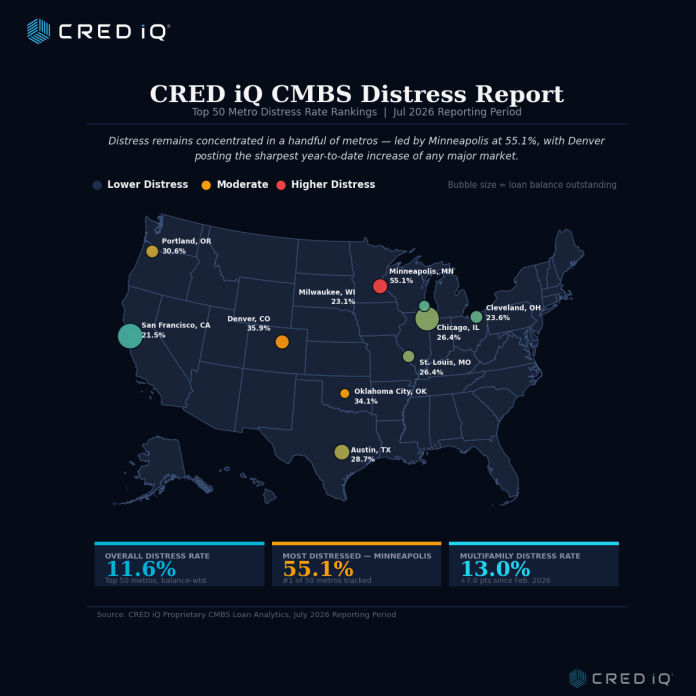
Top 50 U.S. metros by balance-weighted CMBS distress rate, July 2026 reporting period.

Across the 50 largest CMBS markets, $45.8 billion of $393.5 billion in outstanding balance is currently distressed, a balance-weighted rate of 11.6%. Minneapolis (55.1%), Denver (35.9%), and Oklahoma City (34.1%) lead the rankings, each shaped by a handful of very large loans rather than broad weakness, while Salt Lake City sits at zero, the cleanest metro in the Top 50. Underneath it all, the property type driving distress has shifted: multifamily distress has more than doubled since February, from 6.0% to 13.0%, while office has eased from 21.2% to 16.7%.

1. Top 50 Metros Ranked by Distress Rate

Minneapolis, Denver, and Oklahoma City top the list of most distressed metropolitan areas, followed by Portland (30.6%), Austin (28.7%), and a cluster of Midwest metros—Chicago (26.4%), Cleveland (23.6%), and Milwaukee (23.1%), plus San Francisco (21.5%). At the other end, Phoenix, Boston, Las Vegas, and Orlando sit near 3%, with San Diego (0.4%) and Salt Lake City (0%) as the most stable large markets.

Rank Metro (MSA) % Distress Total Outstanding
1Minneapolis–St. Paul–Bloomington, MN-WI55.1%$4.0B
2Denver–Aurora–Centennial, CO35.9%$3.2B
3Oklahoma City, OK34.1%$0.8B
4Portland–Vancouver–Hillsboro, OR-WA30.6%$2.3B
5Austin–Round Rock–San Marcos, TX28.7%$4.7B
6St. Louis, MO-IL26.4%$2.1B
7Chicago–Naperville–Elgin, IL-IN26.4%$16.6B
8Cleveland, OH23.6%$2.3B
9Milwaukee–Waukesha, WI23.1%$1.5B
10San Francisco–Oakland–Fremont, CA21.5%$18.6B
11Cincinnati, OH-KY-IN21.2%$1.6B
12Hartford–West Hartford–East Hartford, CT20.6%$1.0B
13Birmingham, AL19.6%$1.2B
14Pittsburgh, PA18.2%$2.2B
15Philadelphia–Camden–Wilmington, PA-NJ-DE-MD16.3%$11.3B

2. What’s Driving It: Property Type and Region

Office remains the largest source of cumulative distress at 16.7% ($22.5 billion, roughly half of all distressed balance nationally), followed by Mixed Use (14.4%), Multifamily (13.0%), Lodging (10.6%), and Retail (8.8%); Industrial is the clear outperformer at just 1.0%.

Regionally, the Midwest’s ten metros average 22.7% distress, driven by concentrated issues in Minneapolis, Chicago, St. Louis, Cleveland, Milwaukee, and Cincinnati, while the Northeast, West, and South all cluster near 10%.

3. July Movers and the Trend Since February

In July, 180 loans totaling $992 million newly became distressed—96% of which was multifamily, led by an $84 million Houston apartment loan, with the largest single event a joint $111 million special-servicing transfer of two Santa Monica hotels. Since February, Denver has moved the most of any major metro, jumping 13.5 points (22.4% → 35.9%) on two large office defaults to become the #2 most-distressed market nationally. Minneapolis held steady at #1. Portland and Oklahoma City both improved by several points, while New York, Los Angeles, and Washington DC stayed roughly flat.

The bigger story is the property-type shift: office distress fell nearly five points since February even as multifamily more than doubled.

Deals That Drove Distress in July

  • Weston Medical Center Apartments (Houston, TX) — $84.0M, newly 60+ days delinquent
  • Ariza Forest View (Santa Rosa Beach, FL) — $61.0M, newly late (<30 days)
  • Mirasol (Las Vegas, NV) — $53.1M, newly delinquent at performing maturity
  • Solaire Bethesda (Bethesda, MD) — $49.6M, newly late (<30 days)
  • The Sophia Apartments (Dallas, TX) — $38.9M, newly 60+ days delinquent

Other Notable July Movers

  • Bank of America Tower (Midland, TX) — $19.0M, newly 121+ days delinquent; part of a five-property, ~$43M distressed office portfolio in Midland
  • Hawthorne At Clairmont (Atlanta, GA) — $36.6M multifamily loan, newly late
  • Multiple small Brooklyn, NY multifamily loans (836 DeKalb Avenue, 105–107 Vanderveer Street, 431 Grand Street) newly delinquent in July

Source: CRED iQ Proprietary Loan Analytics  |  Conduit & SBLL  |  July 2026  |  cred-iq.com

Methodology

Distress rate is defined as distressed outstanding loan balance (loans currently delinquent and/or in special servicing) divided by total outstanding loan balance, for CMBS Conduit and SBLL loan pools. Rankings reflect the 50 U.S. metropolitan statistical areas with the largest total CMBS loan balance as of the July 2026 reporting period. Regional groupings assign each metro to a U.S. Census-style region (Northeast, Midwest, South, West) based on its primary state. Multi-state metros are attributed to their first-listed state.

CRED iQ provides proprietary CMBS loan-level analytics, distress surveillance, and commercial real estate data to CMBS investors, originators, brokers, and lenders. For access to the underlying loan-level dataset behind this report, visit crediq.com.

CMBS Distress Hits a 2026 High

0
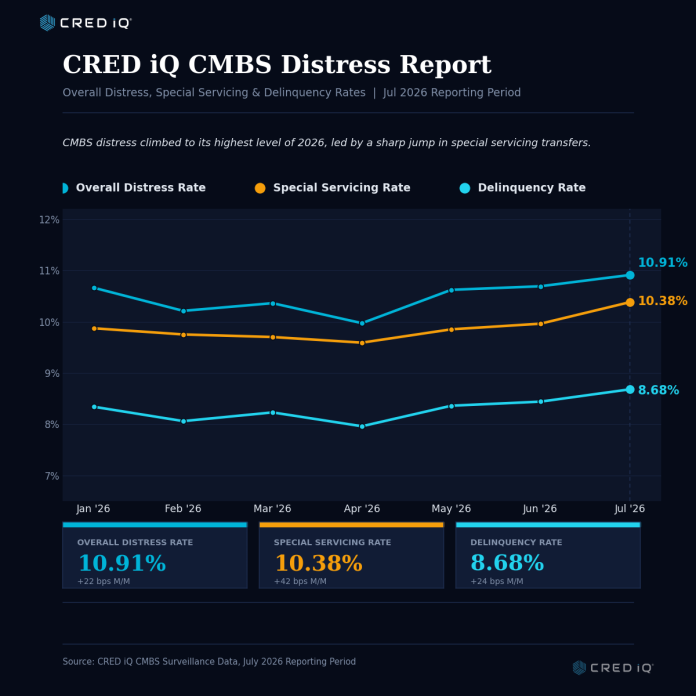
Line chart titled "CRED iQ CMBS Distress Report" showing three trend lines from January to July 2026: Overall Distress Rate, Special Servicing Rate, and Delinquency Rate. All three rates rise over the period, with July 2026 values highlighted at 10.91%, 10.38%, and 8.68% respectively. Below the chart, three stat cards show the July 2026 figures with month-over-month changes of +22, +42, and +24 basis points. CRED iQ logo appears in the top-left corner.
CMBS distress climbed to its highest level of 2026 in July, with the Overall Distress Rate reaching 10.91%, the Special Servicing Rate 10.38%, and the Delinquency Rate 8.68% — driven primarily by a sharp jump in special servicing activity. (Source: CRED iQ CMBS Surveillance Data, July 2026 Reporting Period.)

CRED iQ’s July 2026 surveillance data shows the Overall Distress Rate for CMBS climbed to 10.91%, up 22 basis points month-over-month, driven primarily by a 42-bps jump in the Special Servicing Rate to 10.38%. The Delinquency Rate rose more modestly, to 8.68%.

For CRE and CMBS investors, brokers, and lenders trying to separate signal from noise in a choppy market, granularity is everything. CRED iQ’s July 2026 Reporting Period data offers exactly that: a loan-level view of distress across the $600+ billion CMBS universe, broken out by servicing status, deal type, property type, and metro area.

Three Numbers That Matter

Overall Distress Rate (10.91%) captures every loan that is either specially serviced or 30+ days delinquent, the broadest lens on portfolio stress. It has trended upward for three straight months, reversing April’s modest relief (9.97%).

Special Servicing Rate (10.38%) is the more forward-looking indicator, capturing loans referred for workout, modification, or foreclosure, often before a formal delinquency shows up. July’s 42-bps jump was the sharpest single-month move of the year.

Delinquency Rate (8.68%) measures loans actually missing payments. Its steadier 24-bps climb shows that while special servicing referrals are accelerating, the pace of loans going truly non-performing is more gradual, a nuance visible only when the three metrics are tracked separately rather than blended into one headline.

Why the Gap Between Special Servicing and Delinquency Matters

The widening spread between the two rates is itself a signal. When special servicing outpaces delinquency, loans are typically being transferred proactively, tied to upcoming maturities, cash management triggers, or borrower requests for relief, rather than because payments have already stopped. CRED iQ’s deal-type data shows Conduit and SASB loans behaving differently too: Conduit-sourced delinquent balances outpaced SASB in July, even as SASB’s delinquent share of its own pool stayed elevated.

Where the Distress Is Concentrated: Property Type and Metro Breakdown

The blended 10.91% headline masks real dispersion by property type. Office is the clear outlier at a 16.65% distress rate, roughly 53% above the market-wide average, with special servicing, not just missed payments, driving the sector’s stress. Mixed-use (13.01%) and Multifamily (11.21%) also run above the blended rate, while Industrial (2.35%) and Self Storage (0.28%) remain the healthiest major property types by a wide margin.

Distress is similarly uneven across metros. A handful of large markets, concentrated on the West Coast and in the Midwest, are running distress rates more than double the national average, driven almost entirely by special servicing activity rather than outright delinquency. Other major metros remain comfortably below 3%. That spread is the point: a single national number tells CRE and CMBS professionals almost nothing about which specific markets carry the risk.

Why Granularity Wins

Headline distress figures are useful for a quick read, but pricing risk, structuring a bridge loan, or advising a special servicer client requires more. CRED iQ tracks these metrics down to the individual loan, property type, MSA, and servicer, letting users isolate exactly where stress is building instead of relying on a single blended rate.

For CRE investors, brokers, and lenders who need to move from headline to loan-level insight in seconds, CRED iQ’s data and analytics platform is built precisely for that job, turning CMBS surveillance data into decision-ready intelligence.

Source: CRED iQ CMBS Surveillance Data, July 2026 Reporting Period. Descriptive, not a forecast.

About CRED iQ

CRED iQ is the enterprise data and intelligence platform powering the securitized commercial real estate market, spanning CMBS, SASB, CRE CLO, and GSE/Agency Multifamily. Delivered via web platform, API, bulk feeds, and MCP server, CRED iQ is the data provider of choice for institutional market participants and the canonical data layer for AI-driven CRE workflows. Learn more at www.cred-iq.com.

CRE CLO Collateral Trends: What a Handful of the Latest Deals Reveal

0

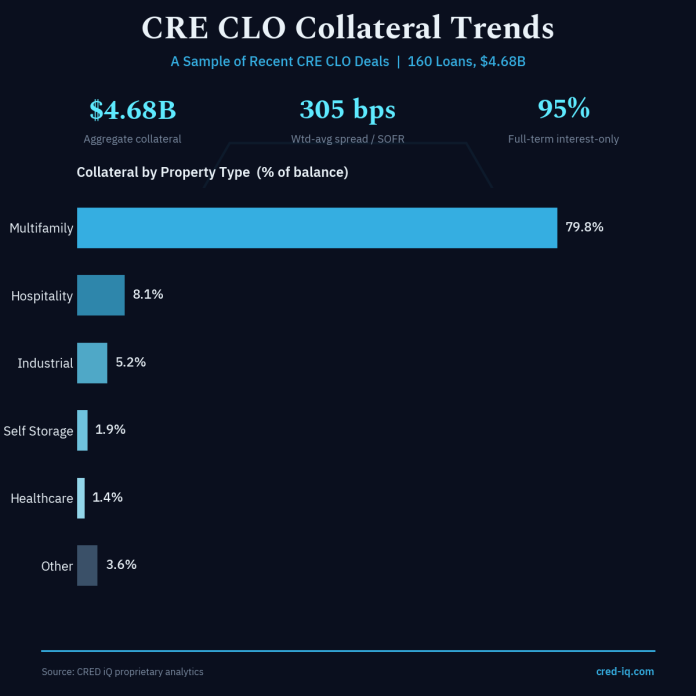
A handful of the latest CRE CLO deals lean hard into multifamily collateral and full-term interest-only structures. CRED iQ analyzed loan-level collateral across a handful of the latest CRE CLO deals totaling $4.68 billion and 160 loans of collateral, and the profile points to lenders concentrating risk in the sectors and structures they trust most in a higher-rate environment.

What property types dominate the newest CRE CLO deals?

Multifamily anchors the sample. Apartment collateral makes up 79.8% of aggregate balance in the sample, followed by hospitality at 8.1% and industrial at 5.2%. Office, retail, and healthcare each account for roughly one percent or less. The concentration confirms that CRE CLO issuers remain committed to transitional multifamily lending even as other property types stay largely on the sidelines.

How are the loans structured?

Interest-only terms are nearly universal. Full-term IO loans represent 95% of collateral balance, with the small remainder carrying partial IO or amortization. The structure preserves borrower cash flow during business-plan execution, but it also means principal paydown is minimal until maturity, keeping refinancing pressure front and center. The sampled pools carry a weighted-average spread of 303 basis points over SOFR and a weighted-average coupon near 6.68%.

What does this signal for CRE CLO issuance in 2026?

These deals point to a familiar core: multifamily assets, floating-rate coupons, and IO structures that maximize early cash flow. Future funding commitments total $244 million across these deals, signaling continued appetite to finance value-add and lease-up business plans. Geographic exposure skews toward New York, Florida, and Texas, which together account for more than 43% of balance.

For investors, the takeaway is concentration. These deals offer exposure to a tightly defined slice of the market, and the reliance on full-term IO means credit performance will hinge on borrowers refinancing or selling at maturity rather than deleveraging along the way.

Source: CRED iQ proprietary analytics. Figures reflect loan-level collateral across a sample of recent CRE CLO transactions. Descriptive, not a forecast.

About CRED iQ

CRED iQ is the enterprise data and intelligence platform powering the securitized commercial real estate market — spanning CMBS, SASB, CRE CLO, and GSE/Agency Multifamily. Delivered via web platform, API, bulk feeds, and MCP server, CRED iQ is the data provider of choice for institutional market participants and the canonical data layer for AI-driven CRE workflows. Learn more at www.cred-iq.com.

Bank Real Estate Credit Since 2019: Where Balances Grew, and by How Much

0

A data briefing on the composition of $6.1 trillion in U.S. bank real estate loans

By the CRED iQ Research Team  ·  Bank Loan Analytics

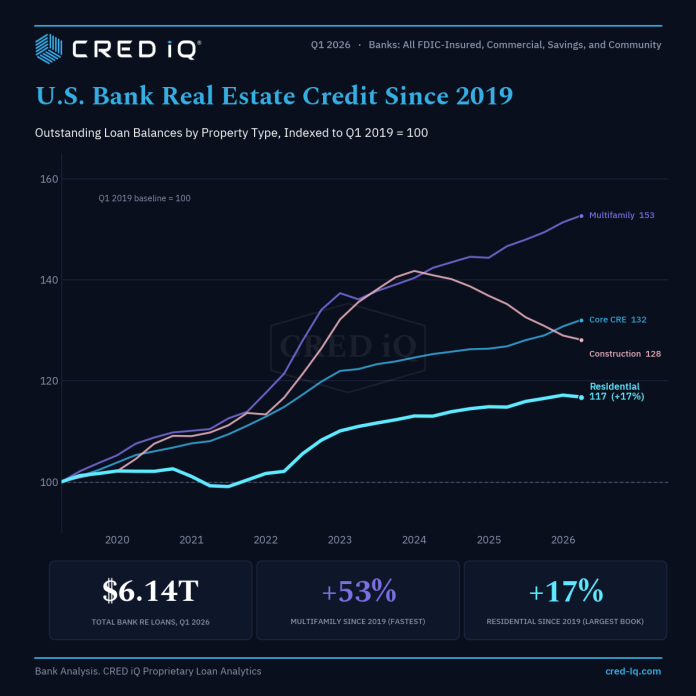
Summary. U.S. bank real estate loan balances totaled $6.14 trillion in the first quarter of 2026. Since the first quarter of 2019, the composition of that book has shifted measurably. Multifamily balances grew the fastest in percentage terms, rising about 53%, while the much larger residential book grew about 17%. In dollar terms the ordering differs: core CRE and residential each added more than $440 billion, and multifamily added about $229 billion. This briefing presents the underlying figures and the methodology behind them, without forecast or recommendation.

The data

The figures below draw on CRED iQ bank loan analytics and cover all FDIC-insured commercial, savings, and community banks. Balances are outstanding loan amounts as of quarter-end. Indexing each category to its first-quarter 2019 level (set to 100) isolates growth from the large differences in starting size across property types.

As of the first quarter of 2026, multifamily balances stood at an index of 153 (about 53% above the 2019 level), core CRE at 132 (about 32%), construction and development at 128 (about 28%), and residential at 117 (about 17%). Residential, which comprises 1-4 family residential mortgages and home equity, remained the largest category at $3.10 trillion, roughly half of all bank real estate lending, followed by core CRE at $1.92 trillion, multifamily at $665 billion, and construction at $453 billion.

Percentage growth and dollar growth diverge

Growth measured in percent and growth measured in dollars point to different segments. Residential added approximately $445 billion in outstanding balances since the first quarter of 2019 and core CRE added approximately $467 billion, each exceeding the roughly $229 billion added by multifamily, despite multifamily posting the largest percentage gain. The distinction matters for gauging where the largest absolute exposures have accumulated on bank balance sheets, as opposed to where growth has been proportionally most rapid.

Construction and development: a distinct pattern

Among the four categories, construction and development shows the most pronounced change in direction. Indexed to 2019, construction balances rose to a peak near 142 in 2024 before declining into early 2026, ending at 128. This rise-and-partial-reversal pattern is consistent with a period of expanded development lending that has since moderated. It is specific to the post-2019 window and is not evident in longer time series that are shaped by the sector’s post-2008 contraction and recovery.

Methodology and definitions

Balances reflect outstanding loans held by FDIC-insured institutions and exclude loans originated and sold into secondary markets. A substantial share of newly originated 1-4 family mortgages is securitized rather than retained on bank balance sheets, which is one factor behind residential’s comparatively modest balance-sheet growth relative to origination activity. Property-type categories follow standard bank regulatory classifications: nonfarm nonresidential (core CRE), multifamily residential, construction and development, and 1-4 family residential plus home equity (residential). Index values are computed as the ratio of each quarter’s balance to the first-quarter 2019 balance, multiplied by 100.

Source: CRED iQ Bank Loan Analytics and Bank Data Analysis, as of Q1 2026. Balances indexed to Q1 2019 = 100. Figures reflect all FDIC-insured commercial, savings, and community banks. This briefing is descriptive and does not constitute a forecast or investment advice.

cred-iq.com

CRED iQ Appoints Liam Mulcahy as Senior Product Manager, CRE Data & Applied AI

0

Data scientist and CRE technology leader to drive the company’s next generation of AI-powered data products

PHILADELPHIA, PA — CRED iQ, a leading commercial real estate data and analytics platform, today announced the appointment of Liam Mulcahy as Senior Product Manager, CRE Data & Applied AI. In the role, Mulcahy will lead the development of new data and analytics products that pair CRED iQ’s proprietary distress and loan-level intelligence with applied artificial intelligence.

Mulcahy brings a rare combination of data engineering, applied AI, and commercial real estate experience to CRED iQ. He most recently co-founded an AI analytics venture focused on helping commercial real estate firms compete in AI search, where he built multi-model data pipelines spanning the major large language model platforms and a broker-facing analytics dashboard. Earlier, he led revenue and pricing strategy across a 3,500-plus unit multifamily portfolio at Post Brothers, and spent several years at CoStar Group building data automation, business intelligence, and machine learning tools while working directly with brokers, owners, and investors. He holds a Master of Science in Data Science from the University of Virginia.

“The CRE market is moving faster than the tools most firms use to read it, and we don’t close that gap by hiring product managers, we hire people who’ve lived the problem,” said Michael Haas, Founder and CEO of CRED iQ. “Liam has built data systems at CoStar, run revenue for a 3,500-unit portfolio, and shipped AI analytics for CRE. He joins us to pair that experience with our proprietary distress and loan-level data so our clients see risk and opportunity before anyone else does.”

In his new role, Mulcahy will own data and analytics products end to end, partnering across engineering, sales, and customer success. His early focus will include smarter trigger-event detection and new AI-driven ways for CRED iQ customers to work with the company’s data.

“CRED iQ has built something the market genuinely relies on, and the data underneath it is exceptional, and customers want to bring this data into their AI workflows.” said Mulcahy. “The opportunity to apply AI to that foundation, and to build tools that help our customers act faster and with more confidence, is exactly the work I want to be doing. I’m thrilled to join the team.”

About CRED iQ

CRED iQ is a commercial real estate data and analytics platform serving CMBS analysts, special servicers, lenders, brokers, and investors. The company’s proprietary distress and loan-level data gives clients a differentiated, real-time view of the market, powering research, underwriting, and origination workflows. CRED iQ is headquartered in Philadelphia, Pennsylvania.

Media Contact

CRED iQ

info@cred-iq.com

Bank Multifamily Loan Delinquencies Rise to 1.47% in Q1 2026: CRED iQ Analysis of Bank Data

0

CRED iQ Research  |  Q1 2026  |  Multifamily Bank Loan Performance

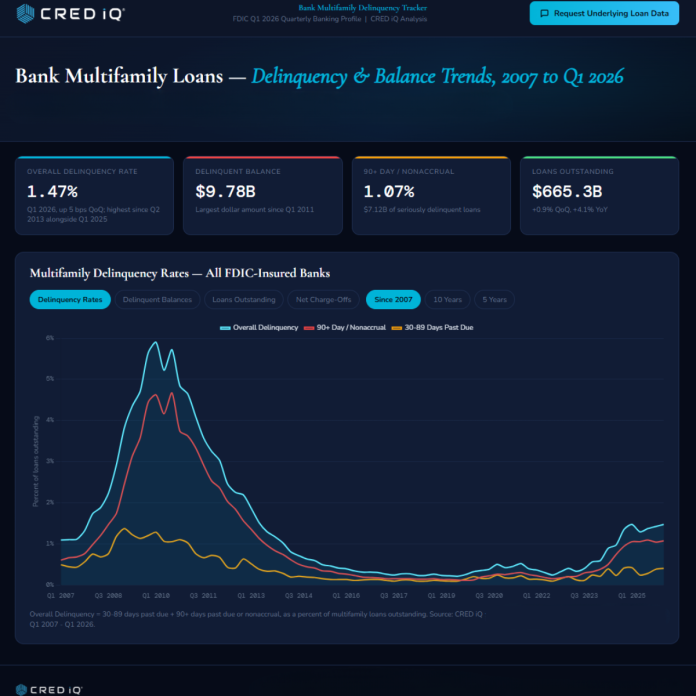
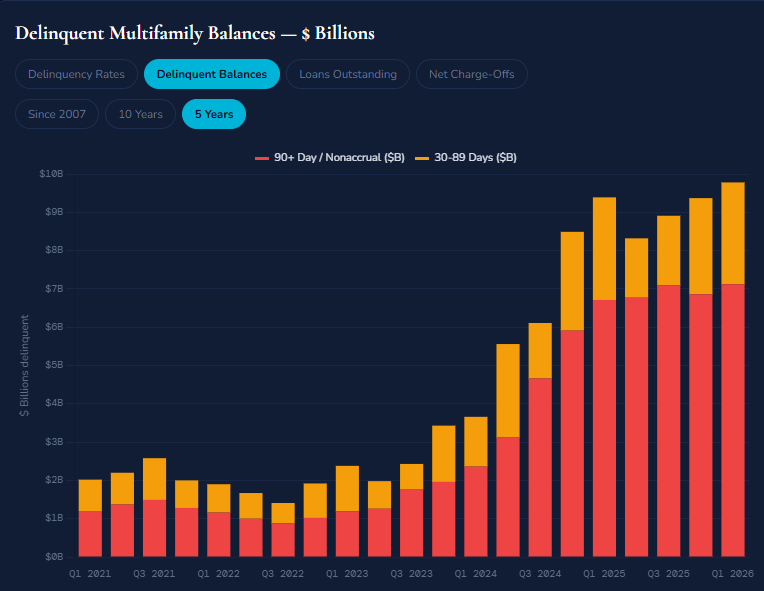
The overall multifamily delinquency rate at FDIC-insured banks climbed to 1.47% in Q1 2026, up 5 basis points from 1.42% at year-end 2025, according to CRED iQ analysis of the latest Banking data. Delinquent multifamily balances reached $9.78 billion, the largest dollar amount since Q1 2011, even as bank multifamily portfolios continued to expand to a record $665.3 billion.

What Do Banks’ Q1 2026 Numbers Show for Multifamily?

CRED iQ tracks bank multifamily performance across three measures. Loans 30-89 days past due rose to 0.40% of balances, or $2.66 billion, up from 0.38% in Q4 2025. Loans 90+ days past due or in nonaccrual status, the seriously delinquent bucket, rose 3 basis points to 1.07%, with dollar volume increasing to $7.12 billion from $6.86 billion. Combined, the overall delinquency rate of 1.47% matches the Q1 2025 reading and marks the joint-highest level of this cycle. The Banking Report itself flagged multifamily past-due and nonaccrual rates as remaining elevated in its Q1 2026 release.

How Does 1.47% Compare Historically?

Outside of the matching Q1 2025 print, banks have not reported multifamily delinquency this high since Q2 2013, when the industry was still working down Global Financial Crisis credit. Today’s rate remains far below the GFC peak of 5.90% set in Q1 2010, when $12.68 billion was delinquent against a much smaller loan base. The more telling comparison is the cycle low: multifamily delinquency bottomed at just 0.21% in Q3 2019, meaning the current rate is seven times its pre-pandemic trough.

Are Banks Still Growing Their Multifamily Books?

Yes. Multifamily loans outstanding at FDIC-insured institutions rose 0.9% quarter over quarter and 4.1% year over year to $665.3 billion, roughly 3.5 times the $192 billion held in early 2007. Growing denominators have masked some of the dollar deterioration: delinquent balances are up $415 million in a single quarter and now sit at 15-year highs even while the rate itself appears moderate.

What Are Losses Telling Us?

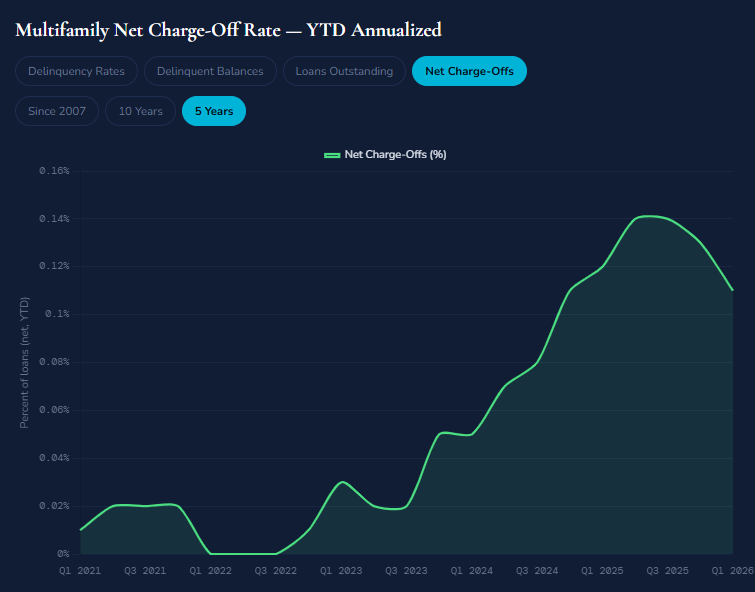
Realized pain remains limited. The multifamily net charge-off rate ran at just 0.11% annualized in Q1 2026, down from 0.13% for full-year 2025. The gap between rising delinquency and muted charge-offs suggests banks are still resolving troubled multifamily credit through extensions and workouts rather than write-downs, a dynamic CRED iQ also observes across CMBS loan modifications.

The Bottom Line

Bank multifamily credit is deteriorating gradually, not collapsing. With $9.78 billion delinquent and balance growth still outpacing resolutions, Q2 2026 data will show whether the seasonal Q1 bump fades or compounds. Explore the full interactive tracker and request the underlying data at cred-iq.com.

Source: CRED iQ analysis of all FDIC-insured institutions, multifamily residential real estate loans, Q1 2007 through Q1 2026.

About CRED iQ

CRED iQ is the enterprise data and intelligence platform powering the securitized commercial real estate market — spanning CMBS, SASB, CRE CLO, and GSE/Agency Multifamily. Delivered via web platform, API, bulk feeds, and MCP server, CRED iQ is the data provider of choice for institutional market participants and the canonical data layer for AI-driven CRE workflows. Learn more at www.cred-iq.com.

2,085FollowersFollow
6SubscribersSubscribe